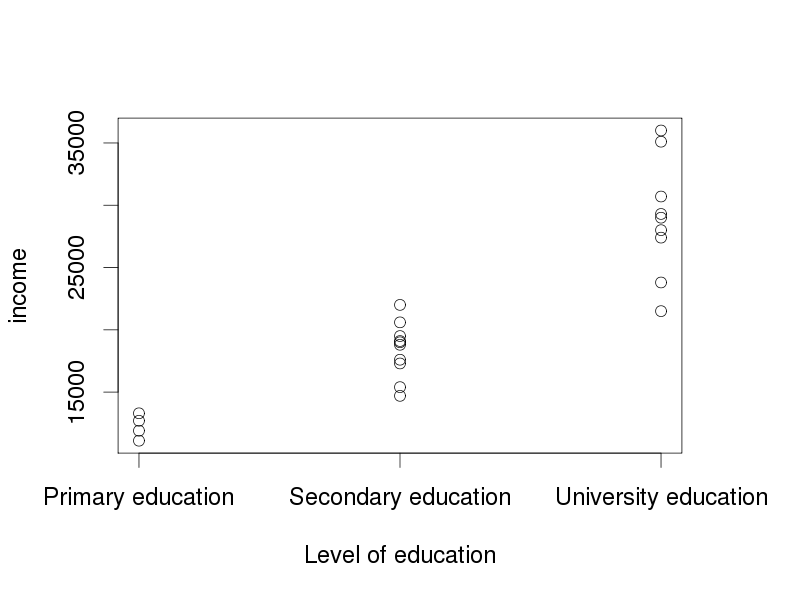
Problem: A bivariate plot with one factor (nominal variable) and one numerical (scale-level) variable. table.plot() is great for frequencies, but here I wanted to plot the actual observations instead.
primary.education <- c(12700, 13300, 11100, 11900)
secondary.education <- c(19500, 22000, 19100, 20600, 18800, 17300, 14700,
                         15400, 19000, 17600)
university.education <- c(36000, 29000, 30700, 35100, 21500, 23800, 28000,
                          29300, 27400)
plot(c(rep(1, length(primary.education)),
       rep(2, length(secondary.education)),
       rep(3, length(university.education))),
     c(primary.education, secondary.education, university.education),
     type = "p", ylab = "income", xlab = "Level of education", xaxt = "n")
axis(1, at = 1:3, labels = c("Primary education",
                             "Secondary education", "University education"))
![[Valid RSS]](valid-rss-rogers.png "Validate my RSS feed")

