Slowly, I am coming to grips with functional programming. It feels good.
In data manipulation tasks with R (which is where I spend a good deal of my time at work) functional programming construct often means using (implicit) queries instead of loops. In an analysis of child deprivation in India, I met with a problem that I would like to share with you.
We measure child deprivation with seven indicators: lack of sanitation, water, information, food, education, healthcare, shelter. All of these are dichotomous: a child is either deprived or not deprived. We have also created an additive index in which we simply sum up the number of deprivations for each child. Now, caste membership is obviously associated with different expected number of deprivations: children from the lower castes have a higher number of deprivations than children from higher castes. But there is a significant variation between the indian states as to how much worse off a lower caste child is than a higher caste child. We wanted to know which particular deprivations that drive these differences.
I first calculated the probability of deprivation for each type of deprivation for each caste in each state. The initial state of the data was something like this
my.df[sample(nrow(my.df), 5),]
         sanitation        water  information food    education healthcare      shelter                caste          state
70688  not deprived not deprived not deprived <NA> not deprived       <NA> not deprived        none of above          delhi
358672 not deprived not deprived not deprived <NA> not deprived       <NA> not deprived        none of above madhya pradesh
410526     deprived not deprived     deprived <NA> not deprived       <NA>     deprived        none of above    maharashtra
242060 not deprived not deprived not deprived <NA> not deprived       <NA> not deprived      scheduled tribe      meghalaya
168874 not deprived not deprived not deprived <NA>         <NA>       <NA>     deprived other backward class          bihar
To be able to calculate deprivation means per caste and state, I recoded "not deprived" to zero and "deprived" to one:
binary.temp.df <- data.frame(sapply(c("sanitation", "water", "information",
 "food", "education", "healthcare", "shelter"), function(x) {
  ifelse(my.df[[x]] == "deprived", 1, 0)
}))
And then I merged this objects with the columns for caste and state to a new object:
binary.df <- cbind(binary.temp.df, my.df[, c("caste", "state")])
binary.df[sample(nrow(binary.df), 5),]
       sanitation water information food education healthcare shelter                caste            state
28134           1     0           1   NA         0         NA       1 other backward class           punjab
211820          0     1           0    1        NA          0       1        none of above          manipur
414651          0     0           0   NA         0         NA       0 other backward class   andhra pradesh
15995           1     0           0   NA         0         NA       1        none of above himachal pradesh
162555          0     0           0   NA        NA         NA       0        none of above            bihar
Calculation of means for each caste and state and type, and the intra-state difference for the highest and lowest caste means:
my.means <- sapply(c("sanitation", "water", "information", "food", "education", "healthcare", "shelter"), function(deprivation.type){
  ## 'for each' type, get the means per caste and state
  temp <- sapply(levels(my.df$caste), function(caste) {
    these <- which(my.df$caste == caste)
    tapply(binary.df[these, deprivation.type], my.df$state[these], mean, na.rm = TRUE)
  })
  ## Get the difference between the highest and the lowest mean (=col) in each state (=row)
  apply(temp, 1, function(y) { diff(range(y, na.rm=TRUE)) })
})
Did the variable caste not change in the above snippet? Not really, caste is the name of the input of the first anonymous function in the above, and while the function recieved different input each time, at no point caste was modified - rather a variable named caste came into existence each time the function was invoked, but it only existed in the context of that function, when the function returned, that variable was gone. Next time the function was invoked, a new variable was created.
The result was the following matrix:
> round(my.means, 2)
                  sanitation water information food education healthcare shelter
jammu and kashmir       0.29  0.34        0.11 0.21      0.13       0.19    0.37
himachal pradesh        0.29  0.07        0.10 0.18      0.02       0.13    0.25
punjab                  0.31  0.02        0.09 0.11      0.11       0.07    0.32
uttaranchal             0.41  0.16        0.10 0.16      0.07       0.13    0.27
haryana                 0.28  0.13        0.12 0.27      0.17       0.14    0.25
delhi                   0.13  0.11        0.02 0.10      0.21       0.08    0.39
rajasthan               0.52  0.09        0.30 0.09      0.14       0.08    0.38
uttar pradesh           0.50  0.25        0.03 0.22      0.07       0.06    0.36
...
What does this matrix represent? For jammu and kashmir and sanition, the result was 0.29, which means that the difference between the caste with the highest mean on sanitation deprivation and the caste with the lowest mean on the sanitation deprivation was 0.29.
The problem I now faced was a general one, not in any way limited to the analysis of child deprivation and caste in India. I wanted a list of all types of deprivation that had the highest difference in at least one state. Since the states are represented by rows and the deprivation types are in the columns the query generalizes to: Find all columns which have at least one row maxima. Looking at the first row, there is a row maxima in the column representing (lack of) shelter, so shelter is a member of this set, but which other columns belong to the set?
my.tab <- table(apply(my.means, 1, function(x) { order(x, decreasing = TRUE)[1] }))
these <- names(my.tab)
colnames(my.means)[as.numeric(these[order(my.tab, decreasing = TRUE)])]
 [1] "sanitation" "shelter"    "food"       "water"      "healthcare"
This far we have not relied on mutable data, nor have we used any looping constructs. Instead we get what we want by querying and storing the results in new objects.
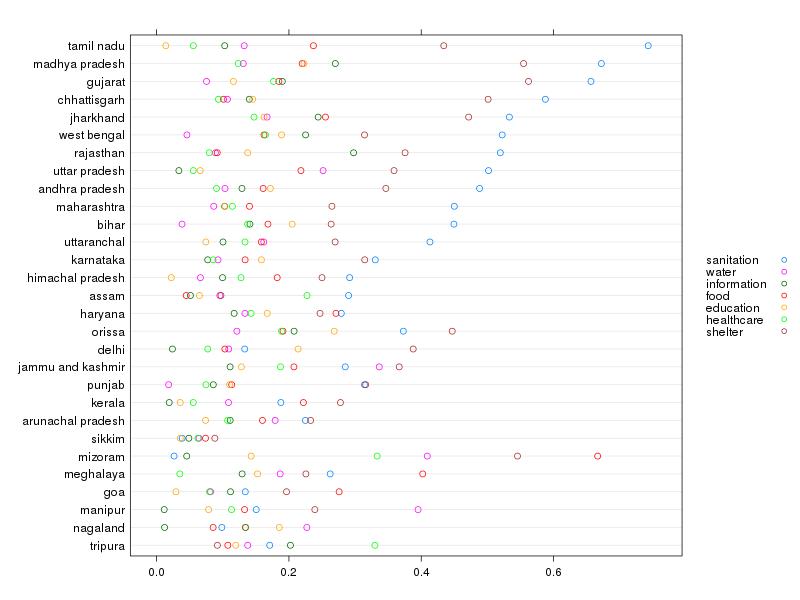
To verify that sanitation really is the most important drive behind the differences in caste means, we can plot my.means with the rows (ie, states) ordered. First, the rows where sanition is the type of deprivation with the highest intra-state caste mean difference, then the rows where shelter is the dominant caste-difference, then the rows with food dominates and lastly the rows where lack of access to water have the largest caste based deviation.
# This is admittedly ugly with way too much hardcoded column positions, but I am tired now.
loo <- which(my.means[,1] - sapply(1:nrow(my.means), function(x) { max(my.means[x,]) }) == 0)
shelt <- which(my.means[,7] - sapply(1:nrow(my.means), function(x) { max(my.means[x,]) }) == 0)
wat <- which(my.means[,2] - sapply(1:nrow(my.means), function(x) { max(my.means[x,]) }) == 0)
food <- which(my.means[,4] - sapply(1:nrow(my.means), function(x) { max(my.means[x,]) }) == 0)
health <- which(my.means[,6] - sapply(1:nrow(my.means), function(x) { max(my.means[x,]) }) == 0)
loo.order <- order(my.means[loo,1])
shelt.order <- order(my.means[shelt,7])
wat.order <- order(my.means[wat,2])
food.order <- order(my.means[food,4])
health.order <- order(my.means[health,6])
print(dotplot(my.means[c(healthcare[health.order], wat[wat.order], food[food.order], shelt[shelt.order], loo[loo.order]), ], xlab = "", type = "p", auto.key = list(space = "right", cex = 0.4), scale=list(y=list(cex=.4), x=list(cex=.4)), par.strip.text = list(cex = 0.4), cex = 0.3))
And here is the result. The extra deprivations that go to lower caste children are most often lack of sanitation and lack of shelter. In some states children of the lower castes tend to lack most in food and water.
What was this all about? Functional programming, immutable data.
R is not a pure functional language, but I like this quote from wikipedias article on immutable objects:
In pure functional programming languages it is not possible to create mutable objects, so all objects are immutable.
In fact, under the hood, R objects are immutable, when you modify an object, R operates on a copy of the object that is to be modified, see "Mutable objects in R", Hadley Wickham (2010).
![[Valid RSS]](valid-rss-rogers.png "Validate my RSS feed")

