Sometimes you need to merge polygons. For me, this happened when I wanted to partition a number of countries into regions to analyse longitudinal household surveys. I used the location of each village or, in urban areas, a neighbourhood, where the survey had been conducted to make a voronoi-diagram.
But some points were just too close, so their area was not useful as a region.
Given a SpatialPolygons object SP, the following code merges small polygons in SP:
## Find small polygons, and merge those, if any
library(geosphere)
areas <- areaPolygon(SP)
these <- head(order(areas), n = length(which(areas < 2.01E8)))
while(length(these) > 0){
    already.merged <- vector()
    neighbours <- poly2nb(SP)
    i <- head(these, 1)
    this.one <- neighbours[[i]][head(order(areas[neighbours[[i]]]), n = 1)]
    print(paste("merging", i, "with", this.one))
    already.merged <- c(already.merged, i, this.one)
    SP <- rbind(SP[-already.merged, ], gUnion(SP[i], SP[this.one]),
                makeUniqueIDs = TRUE)
    ## Determine whether to continue or not
    areas <- areaPolygon(SP)
    these <- head(order(areas), n = length(which(areas < 2.01E8)))
}
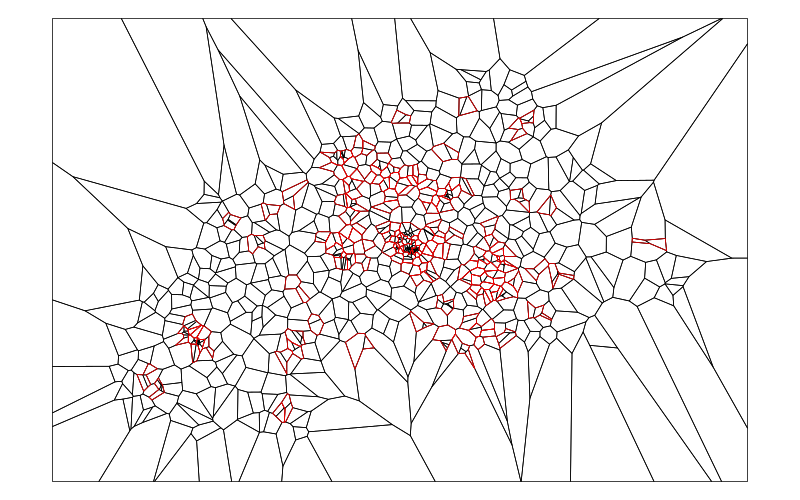
The following code marks the changes. It requires a copy of SP called SP.bak.
old.areas <- areaPolygon(SP.bak)
these <- which(areas %in% old.areas == FALSE)
plot(SP[these], border = "red", add = TRUE)
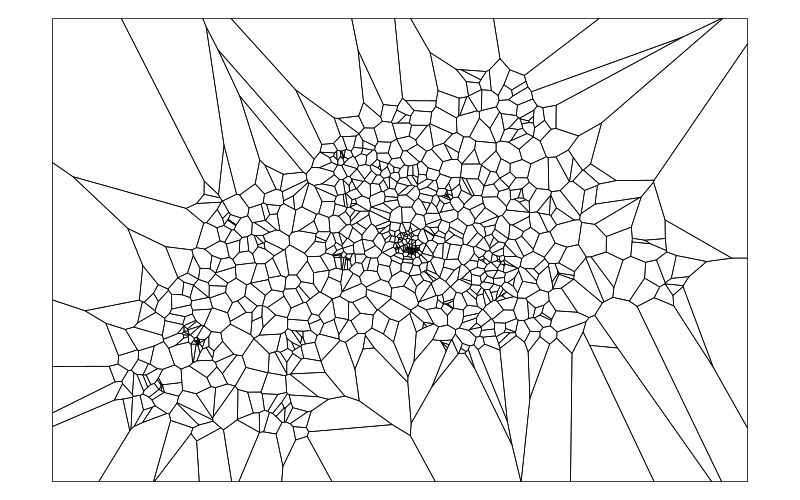
The result looks like this
plot(SP)
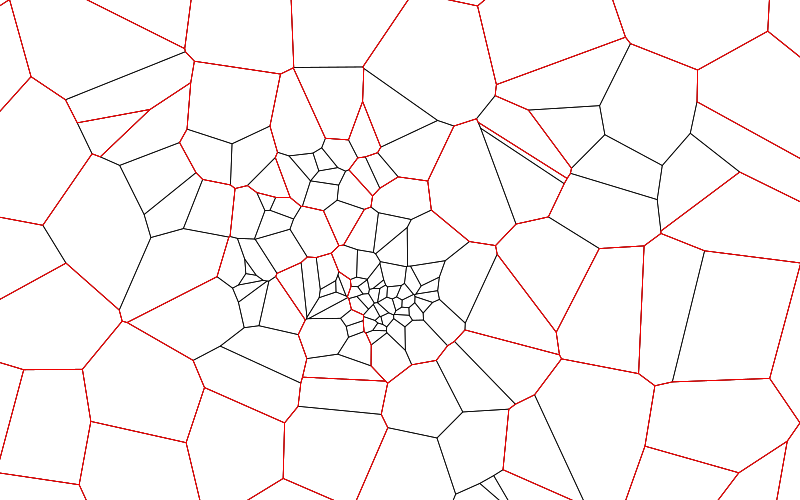
A detailed look at the spot where most of the small areas lay in the original partition shows that the merging has produced a few areas with many concave corners, which reduces their usefulness as an instrument for aggregation. The black lines show the orginial areas, the red lines are the result after merging and the green lines show one particular polygon with many concave corners.
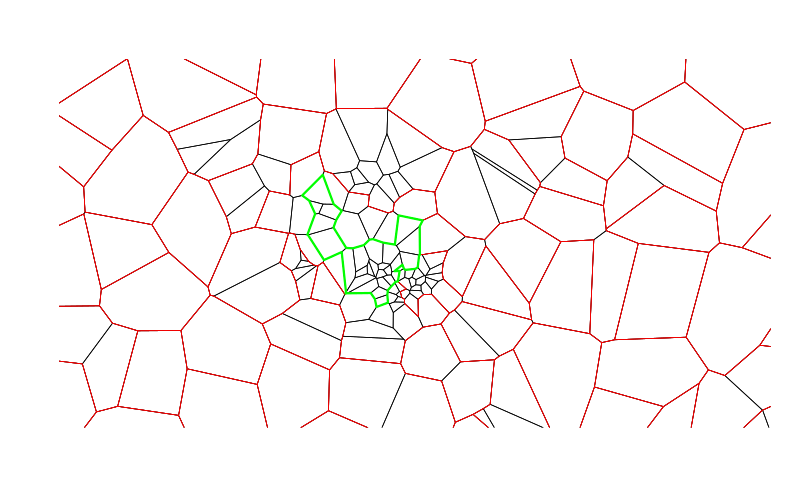
To avoid merging into polygons with many concave corners, we can modify the algorithm - instead of merging with the smallest neighbour, we pick the neighbour which makes the resulting polygon as circle-like as possible, ie, with the smallest ratio between the enclosing line and the area.
## function to find the neighbour which gives the most
## circle-like polygon if we merge with it.
my.good.neighbour.f <- function(i, neighbours, SP){
    line.to.area <- sapply(neighbours[[i]], function(neighbour) {
        resulting.polygon <- gUnion(SP[i], SP[neighbour])
        return(perimeter(resulting.polygon)/areaPolygon(resulting.polygon))
    })
    return(neighbours[[i]][tail(order(line.to.area, decreasing=TRUE), 1)])
}
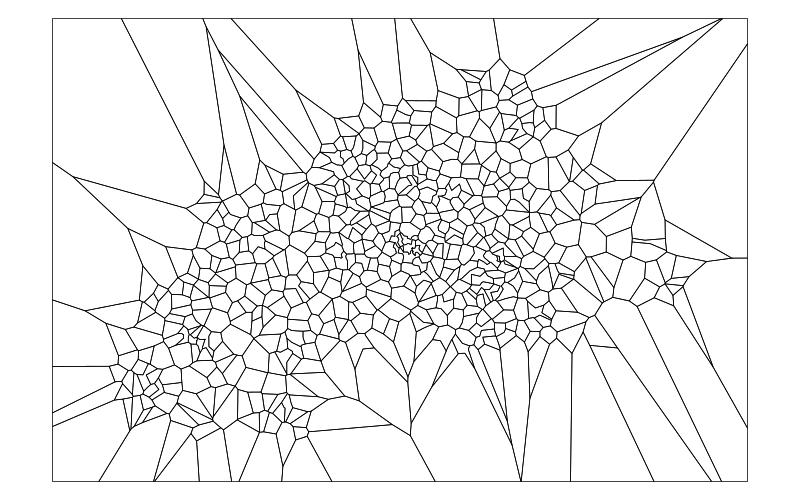
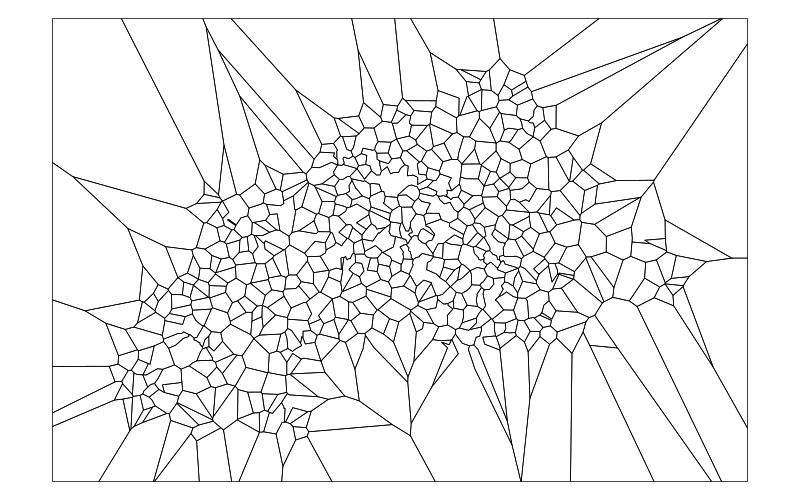
The area shown above would then be partitioned like this:
And the full graph is shown below:
![[Valid RSS]](valid-rss-rogers.png "Validate my RSS feed")

