
[ This post is not about R per se, but R will be used for the implementation. ]
In my experience as a sociologist you always need to compute your dependent variable. It rarely happens that the thing that you (and hopefully, others too) are interested in is something that is directly avaible in the data you are to analyse (In a current study I have the luck to be working with data that others have already compiled into useful measures, but that study is an exception). Instead you, most often, need to define and calculate the measure that is your outcome variable. In a way this is so natural that we don't even give it much of a thought, we just go about and do what has to be done. When recently working on a project it struck me that the analysis I did to a large extent consisted of building complex variables and ploting their distribution, conditional on some other variable. If I have a point here, then it is dependent on that we can distingush between ordinary variables and complex variables and I shall try to define what constitutes a complex variable.
Consider a data set with cases as rows and properties as columns. A complex variable is a variable defined by properties that can not be calculated solely using data in one row. In order to calculate the value of a complex variable, you need to take into account the relation between this row and other rows in the set.
A simple, but rather uninteresting, example of complexity of this kind is the rank-order. To arrive at the particular rank-order of a certain row, all the other rows must be taken into account. The rank-order is uninteresting because there is no particular real world mechanism that is indicated by the rank-order (an explanation for the observed rank-order can of course be sought, e.g. by a regression analysis, but that is as much routine as it gets, and not at all what I am trying to conceptualise in this post). The interesting complex variables that I am thinking about are those which describe real networks in the data. A good example of this is a data set with criminal sentences that I have worked with. Each row in the data set represents one sentence for one convicted person. A person can be convicted several times, and the set of rows that represent the sentences for one person can be said to form a real network with a linear topology (a line network, see the graph below. This typology is sometimes also called a daisy chain) since the nodes, ie the sentences, are ordered (in time). For each person we can calculate the length of his or her linear network of sentences. Also, we can group the cases (the sentences) according the length of the networks that they are nodes in. And we can start asking questions about these groups. For example, which group consists of most cases? Or questions about properties of the persons in the groups (since a person has only one size of the network of his or her sentences, each person can uniquely be classified into one of these groups), e.g. can gender be used to predict in which group a convicted person is likely to turn up in?
Since each sentence can be part of a verdict concerning multiple offenders, we can also create networks of persons convicted for the same crime, that is, convicted for collaborating in the same crime (Crimes differ in whether or not a verdict with multiple offenders implies that these offenders have collaborated. For a crime like arson - which was the crime I was analysing when I got into this - appearing in the same verdict defintely means collaboration, but for other crimes one (central) person can be the only link to the others, and that person is not necessarily self prosecuted for the same crime as the nodes, e.g. when a pimp and his customers are prosecuted. So, you have to apply some knowledge about the subject matter in order to conclude whether or not joint sentencing (or, more generally, the measure you have constructed) is or is not an indicator of a real world network, or at least what typology that network has).
Unlike the linear topology of the ordered nodes of sentences for a certain individual, the network typology of collaborating offenders is a fully connected network, where each node is connected to each other node.
|
| Network typologies. |
The next step is to ask questions about these networks. For example, how common are gender homogeneity and gender heterogeneity in these networks? And does age play into this - in gender heterogeneous networks, are there systematical age differences so that one gender tends to be the older one? In the graph below, the age and gender of all members in all gender heterogenous criminal networks convicted for arson in Sweden between 1993 and 2009 is plotted. (Only networks with at least one person below 25 years of age was included).
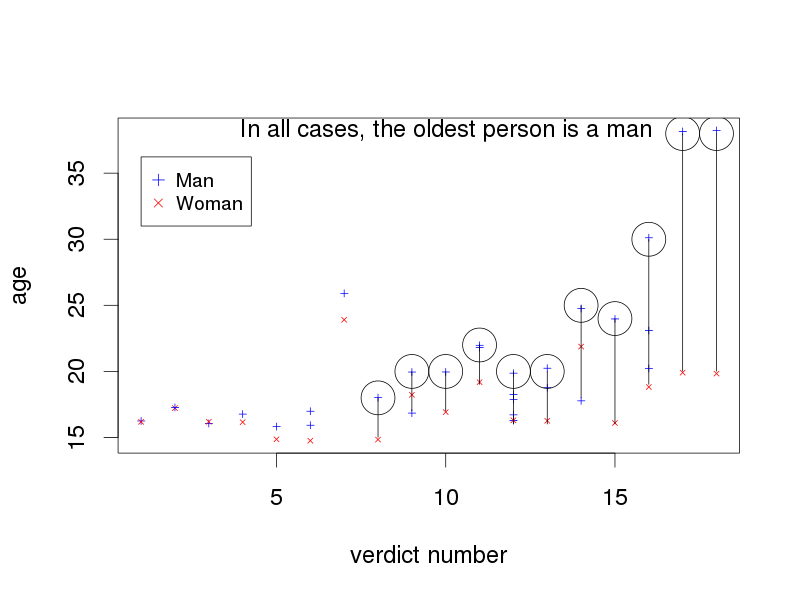 |
| Age differences in 18 gender heterogeneous criminal networks, convicted for arson. Each network consists of the persons that are lined up vertically, and the members of each network was convicted in the same verdict. Circles show the oldest person in the networks with an age range larger than 2 years; they are all men. |
We can also combine the two sets of networks and ask "the persons that have collaborated with others, do they tend to have fewer or more sentences than persons that never collaborated with others?" (This might, as all of the other aspects of criminal behaviour outlined above, be different for different crimes).
Criminal acts is a good example of real world networks that can be constructed by taking into account the values of different rows, ie. compiling complex variables. The data set on sentences was an excerpt of official criminal records. Survey data often offers information on a different set of networks: the household, the family, and/or the couple. A simple example of what can be done with studies that surveys both members of a couple is complex variable age-difference within the couple, which in turn can be conditioned on factors as social class, ethnicity etc.
If the data is sampled in clusters, we can create different measures on the cluster level and use these as contextual variables (For the record, we are not constructing dependent variables when we embark on this kind of analysis). For example, in one study of self-reported criminal activity among pupils, the respondents were sampled at the school level and at the class level, ie. individuals were sampled in clusters with all their class-mates, and some classes belonged to the same school. With this kind of data set, we can ask "when controlling for factors that describe the individual (the values in a single row), what impact do the criminal activities of the peers (the class-mates) exert (values given in other rows) on the likelihood that the individual will execute criminal acts?"
[ Code and more examples to come... ]
![[Valid RSS]](valid-rss-rogers.png "Validate my RSS feed")

