In combination, Beamer and pgfSweave really helps creating graphical presentations for lectures that includes statistical analysis. If tikz is used by sweave to create the graphical content, then the size of that content must be defined explicitly, otherwise the graphs will be too big. Beamer seems to default to a page size of less than the 6 * 6 inches that is the default figure size in pgfSweave. Setting width and heigth within each code-chunk solves the problem.
Here is a minimal working example, save it as sweave-test.Rnw and run pgfSweave on it to get a nice pdf.
> pgfSweave("sweave-test", pdf = T)
Writing to file sweave-test.tex
Processing code chunks ...
 1 : term verbatim tikz
 2 : term verbatim tikz
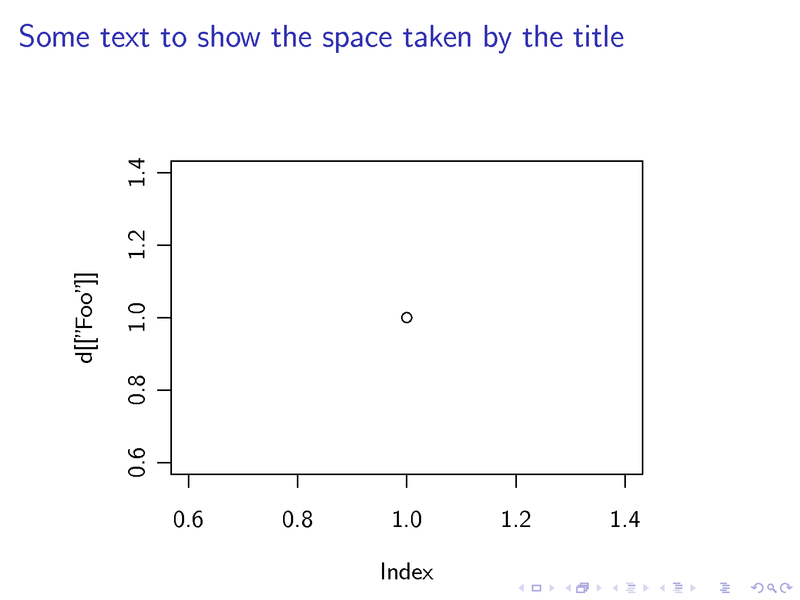
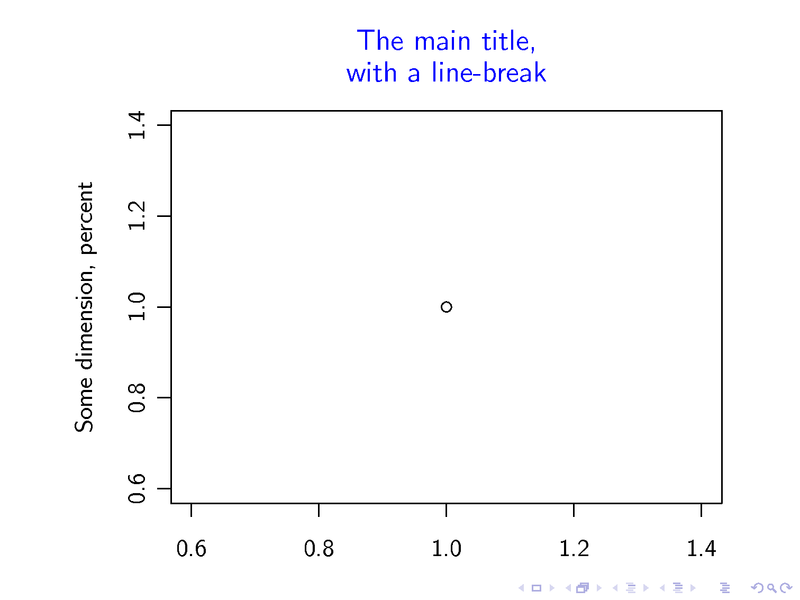
The first page has a title and therefore leaves only 4 * 3.5 inches for the figure, while the second page (or "frame") has no title, so it can be larger: 4.5 * 4.
\documentclass{beamer}

\usepackage{tikz}
\pgfrealjobname{sweave-test}
\usepackage[english]{babel}
\usepackage[utf8]{inputenc}
\usepackage[T1]{fontenc}
\begin{document}

\begin{frame}[fragile]
  \frametitle{Some text to show the space taken by the title}
<<fig=TRUE,echo=FALSE,width=4,height=3.5>>=
d <- data.frame("Foo"=1)
plot(d[["Foo"]])
@
\end{frame}

\begin{frame}[fragile]
<<fig=TRUE,echo=FALSE,width=4.5,height=4>>=
plot(d[["Foo"]], ylab = "Some dimension, percent", xlab = "",
                 main = paste("The main title,", "\n", "with a line-break"),
                 col.main = "blue", font.main = 1)
@
\end{frame}

\end{document}
 |
| Example with the title set by LaTeX |
In the second example, R creates the title, and no extra space is wasted between the title and the figure.
 |
| Example with the title set by R |