 |
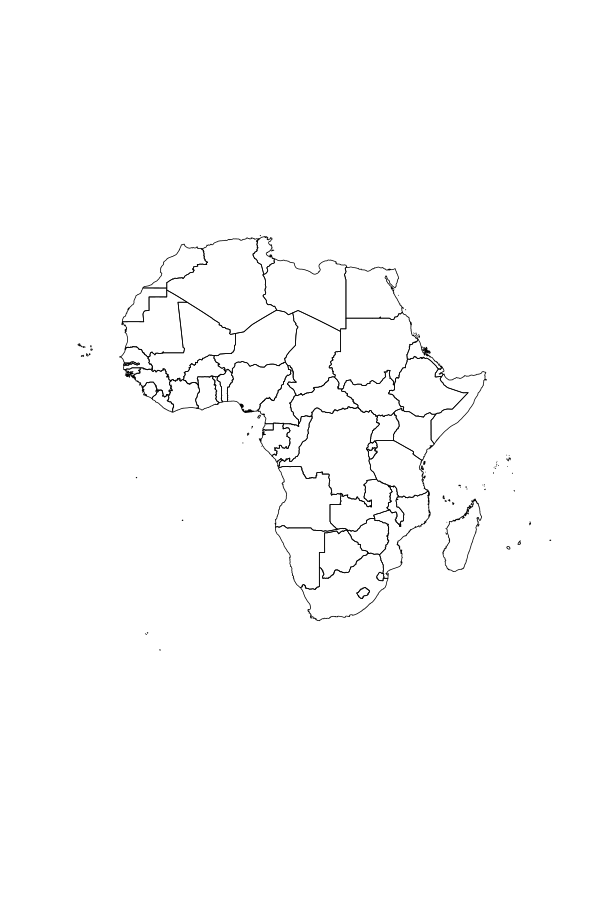
| Africa with country borders and small islands |
As part of my research on poverty and armed conflicts, I needed a map of mainland Africa. The borders of all countries are made publicly avaible by Global Administrative Areas: Boundaries without limits, so I downloaded their global map, which is a file archive of administrative areas at five different levels of precision. The level of the country borders is level 0, a layer which is called gadm_adm0 in the shapefiles of that file archive.
To import the country borders, unzip all files with the file prefix gadm_adm0 into a directory, ie foo. Then issue this command in R:
library(rgdal)
world <- readOGR(dsn="foo/", layer="gadm28_adm0")
where dsn is the name of the directory in which you extracted the gadm_adm0 files.
To get an object with only the borders of the african countries, try:
library(maptools)
africa.by.country <- world[which(world@data$UNREGION2 == "Africa"),]
africa is now an object of class SpatialPolygons, which is perfectly fine. The problems are that this object
|
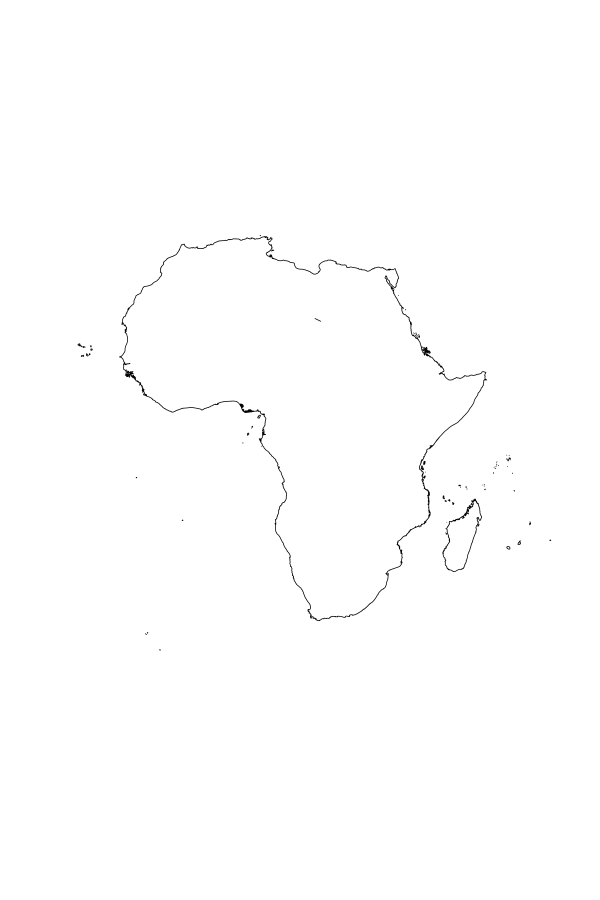
| Africa with country borders and small islands |
africa <- unionSpatialPolygons(polygons(africa.by.country),
                               rep(1, length(africa.by.country)))
This plot of africa shows that the country borders are now removed.
 |
| Africa as one polygon |
africa object includes a lot of polygons, one of which is mainland Africa. First we need to find out which of the polygons is mainland Africa, and it is the one with the largest area.
head(order(sapply(africa@polygons[[1]]@Polygons, function(polygon) {
     polygon@area
}), decreasing=TRUE), 1)
[1] 2335
So, we know that polygon number 2335 is the polygon we want. The classes in sp are complex, they are based on lists of objects, rather than single objects. So to create a SpatialPolygons objects, we need to embed our polygon in two levels of lists like this.
africa.final <- SpatialPolygons(list(
                   Polygons(list(
                   africa@polygons[[1]]@Polygons[[2335]]
                     ), 1)))
proj4string(africa.final) <- proj4string(africa)
This is a plot of africa.final:
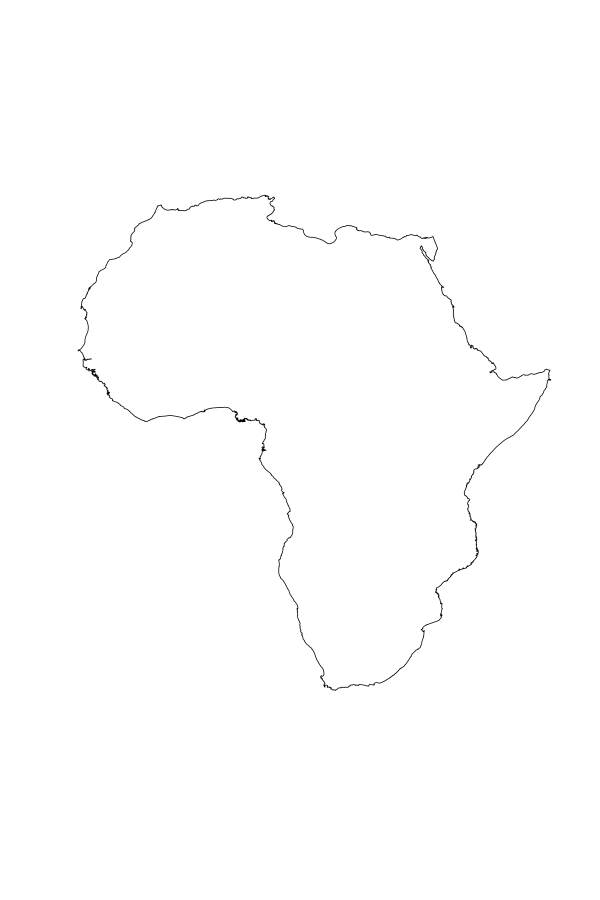 |
| mainland Africa |
To make a grid over mainland Africa, we can use the function makegrid().
sgrd.full <- SpatialPixels(SpatialPoints(makegrid(africa.final, n = 200)),
             proj4string = proj4string(africa.final))
sgrd.final <- sgrd.full[which(is.na(over(sgrd.full, africa.final)) == FALSE)]
plot(africa.final)
plot(sgrd.final, add=TRUE, col="red")
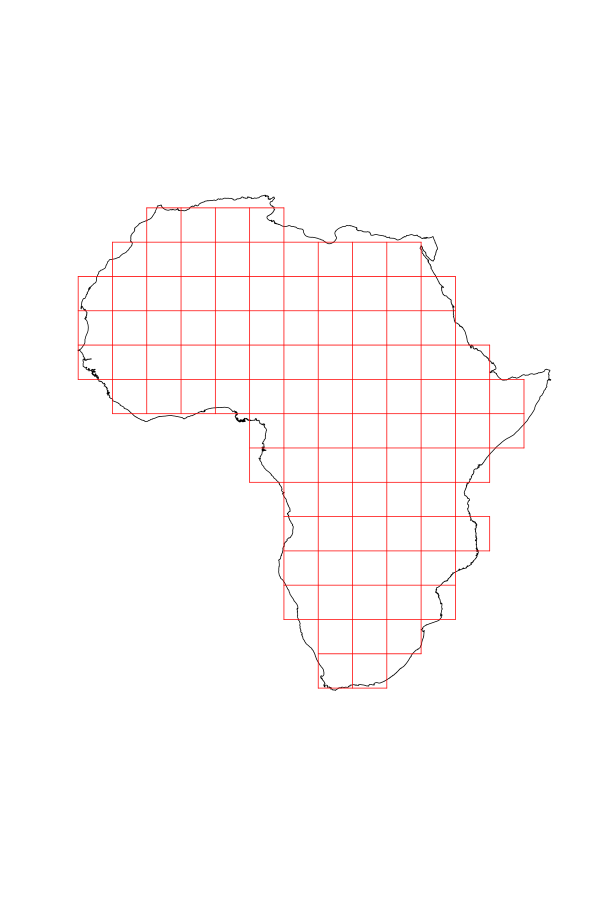 |
| mainland Africa with a grid |
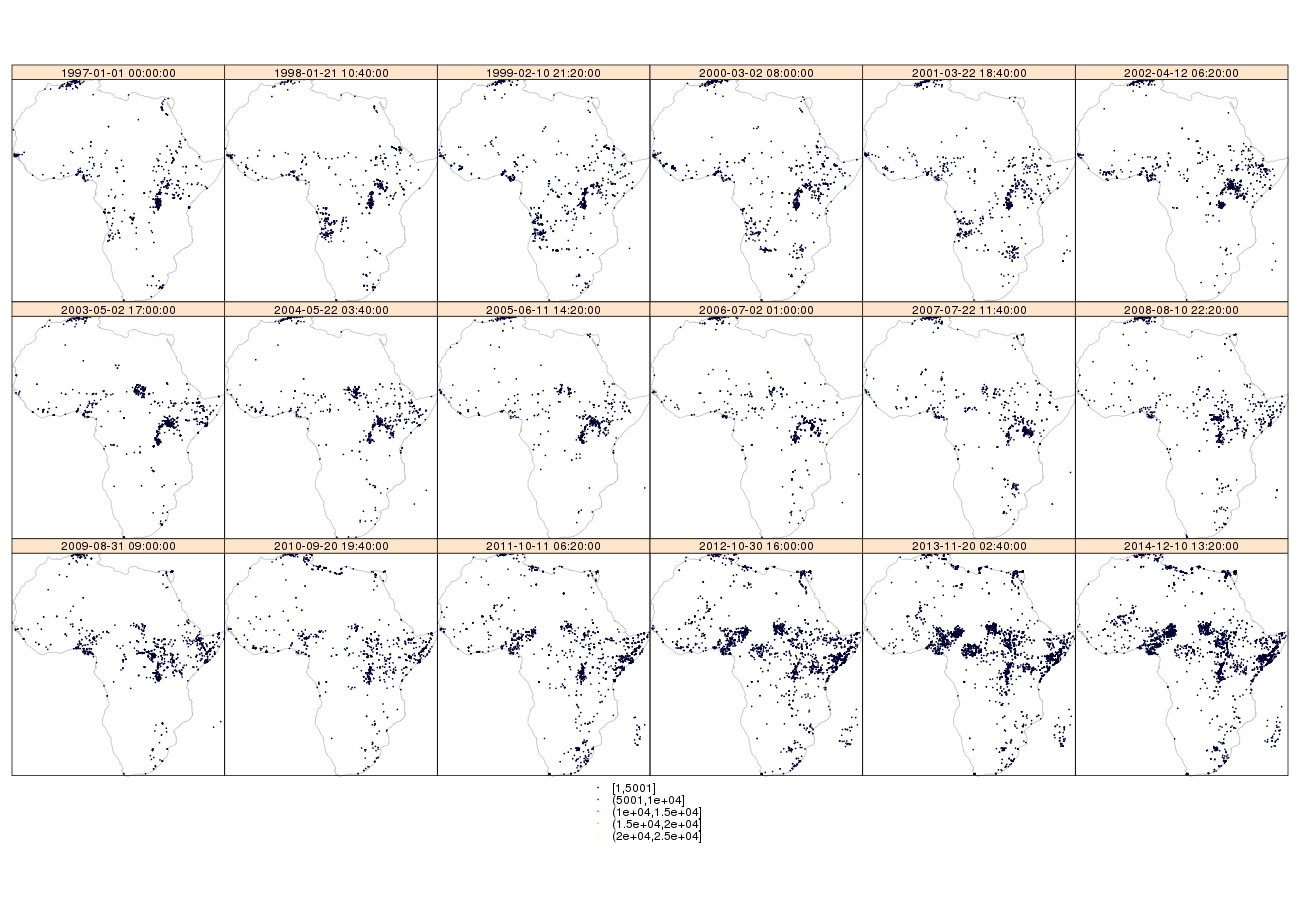 |
| Armed Conflicts, Lethal events in Africa 1997-2015 |
library(rgdal)
acled.spdf <- readOGR(dsn = "ACLED", layer = "ACLED_Version6_Shpfile")
these <- which(acled.spdf@data$EVENT_TYPE %in%
                                  c("Battle-Government regains territory",
                                    "Battle-No change of territory",
                                    "Battle-Non-state actor overtakes territory",
                                    "Violence against civilians") &
                acled.spdf@data$FATALITIES > 0
               )
library(spacetime)
library(gstat)
## create STIDF object
my.STIDF <- STIDF(sp = as(acled.spdf[these,], "SpatialPoints"),
                  time = as.POSIXct(acled.spdf@data$EVENT_DATE[these]),
                  data = data.frame(killed = acled.spdf@data$FATALITIES[these]))
layout <- list(list("sp.lines", africa.final, col= 'grey'))
stplot(my.STIDF, number = 2015-1997, pch = 20, cex = 0.1, sp.layout = layout)
![[Valid RSS]](valid-rss-rogers.png "Validate my RSS feed")

